Global house prices
Global house prices
Our interactive guide to bricks and mortar across the world
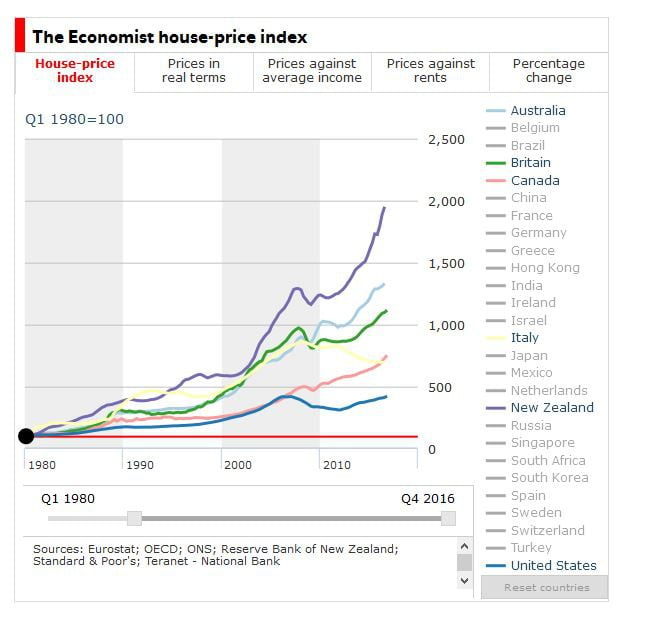
PROPERTY is as safe as houses, at least until the roof falls in. Our latest tally of global housing markets shows that American house prices have recovered to a new nominal high, and that in Spain and Ireland, prices are again rising at a decent clip. In the English-speaking Commonwealth countries of Britain, Canada, Australia and New Zealand, prices have risen largely unabated in recent years.
As our print article this week discusses, some of these rises can be attributed to the influence of foreign money. Since autumn 2014 $1.3trn of capital has flowed out of China. Some of that cash has found its way into residential property in some of the world’s most desirable cities.
In America, Chinese investors bought some 29,000 homes in the 12 months to March 2016 with a total value of $27bn, according to the National Association of Realtors. Much of this money is focused on a handful of cities: Seattle, San Francisco, New York and Miami. Foreign money has helped propel skyrocketing prices in other places, too. In Vancouver, home values have risen by 47% in four years; in London they have risen by 54%; and in Auckland the rise has been a whopping 75%. The influence of foreign capital flows on housing markets is being scrutinised, particularly as affordability becomes ever more stretched.
To gauge whether prices are fairly valued The Economist measures house prices against two metrics: rents and income. If, over the long run, prices rise faster than the revenue a property might generate or the household earnings that service a mortgage, they may be unsustainable.
On this basis homes are fairly valued in America by an average of our two measures. But across Australia, Canada, New Zealand, and to a lesser extent, Britain, they look severely overpriced. Policymakers may well be left scratching their heads, however: increasing housing affordability for citizens and encouraging investment from foreigners are likely to be irreconcilable goals.
Explanation
This interactive chart uses five different measures
- House-price index: rebased to 100 at a selected date
- Prices in real terms: rebased to 100 for the selected date and deflated by consumer prices
- Prices against average income: compares house prices against average disposable income per person, where 100 is equal to the long-run average of the relationship
- Prices against rents: compares house prices against housing rents, where 100 is equal to the long-run average of the relationship
- Percentage change: the percentage change in real house prices between two selected dates
Notes
The data presented are quarterly, often aggregated from monthly indices. When comparing data across countries, the interactive chart will only display the range of dates available for all the countries selected.
We also publish interactive house-price guides to American cities and British regions.
